Free Monthly Budget Template for Google Sheets
This free template helps you plan a month's income and spending and compare it with what actually happened. Type your numbers in two columns; totals, differences and the summary are calculated for you.
The button opens Google Sheets and asks to Make a copy. The copy is saved in your own Google Drive, so it's private and you can change anything. You need to be signed in to a Google account.
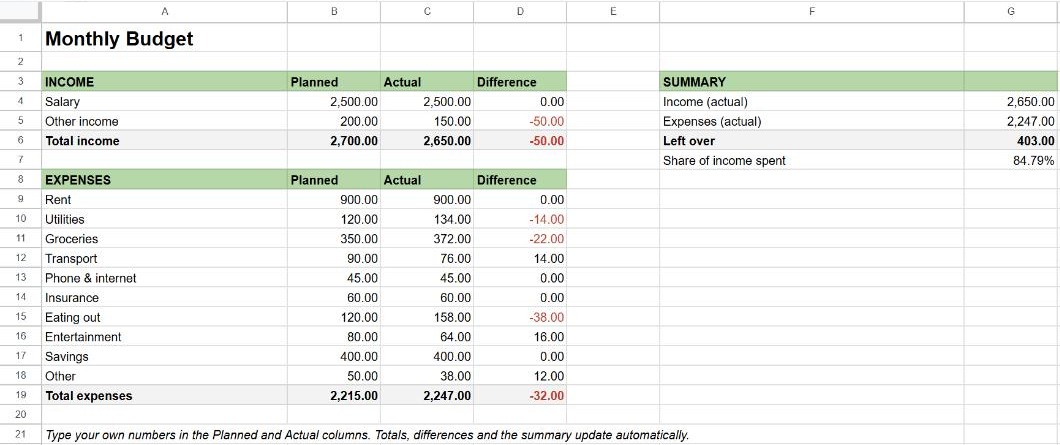
What's included
- Income: salary and other income, planned and actual.
- Expenses: ten common categories, from rent to savings. Rename them to fit your life.
- Difference column: how far each line is from the plan. Red means you spent more than planned.
- Summary: actual income, actual expenses, what's left over, and the share of income you spent.
How to use it
- Make a copy with the button above.
- At the start of the month, fill in the Planned column.
- During or at the end of the month, fill in the Actual column.
- Check the summary: Left over is what you can save or carry forward.
For a new month, duplicate the tab (right-click the tab at the bottom → Duplicate) and clear the Actual column.
The formulas inside
| Cell | Formula | What it does |
|---|---|---|
| Total expenses | =SUM(B9:B18) | Adds the category amounts. See how to sum a column. |
| Difference (expenses) | =B9-C9 | Planned minus actual: negative means overspending. |
| Left over | =G4-G5 | Actual income minus actual expenses. |
| Share of income spent | =IF(G4=0, 0, G5/G4) | A percentage, protected against dividing by zero. See #DIV/0!. |
The red numbers come from a conditional formatting rule: Less than 0 with red text.
Customise it
- Add a category: right-click a row number inside the expenses list and choose Insert 1 row above. The totals include it automatically because the new row sits inside the SUM range. See inserting rows.
- Show your currency: select the numbers and choose Format → Number → Currency.
- Add a chart: select the expense categories and the Actual column, then Insert → Chart and pick a pie chart.
Frequently asked questions
Is the template really free?
Yes. There's no sign-up and nothing to install. Your copy belongs to you.
Can I use it in Excel?
Yes: in your copy, go to File → Download → Microsoft Excel (.xlsx). The formulas and formatting carry over.
Why does "Make a copy" ask me to sign in?
Google needs an account to save the copy to your Drive. We never see your copy or your numbers.